GLOBAL PERSPECTIVES
2,000 Years of Economic History in 1 Chart
Sep 12, 2017 | 11:23 GMT
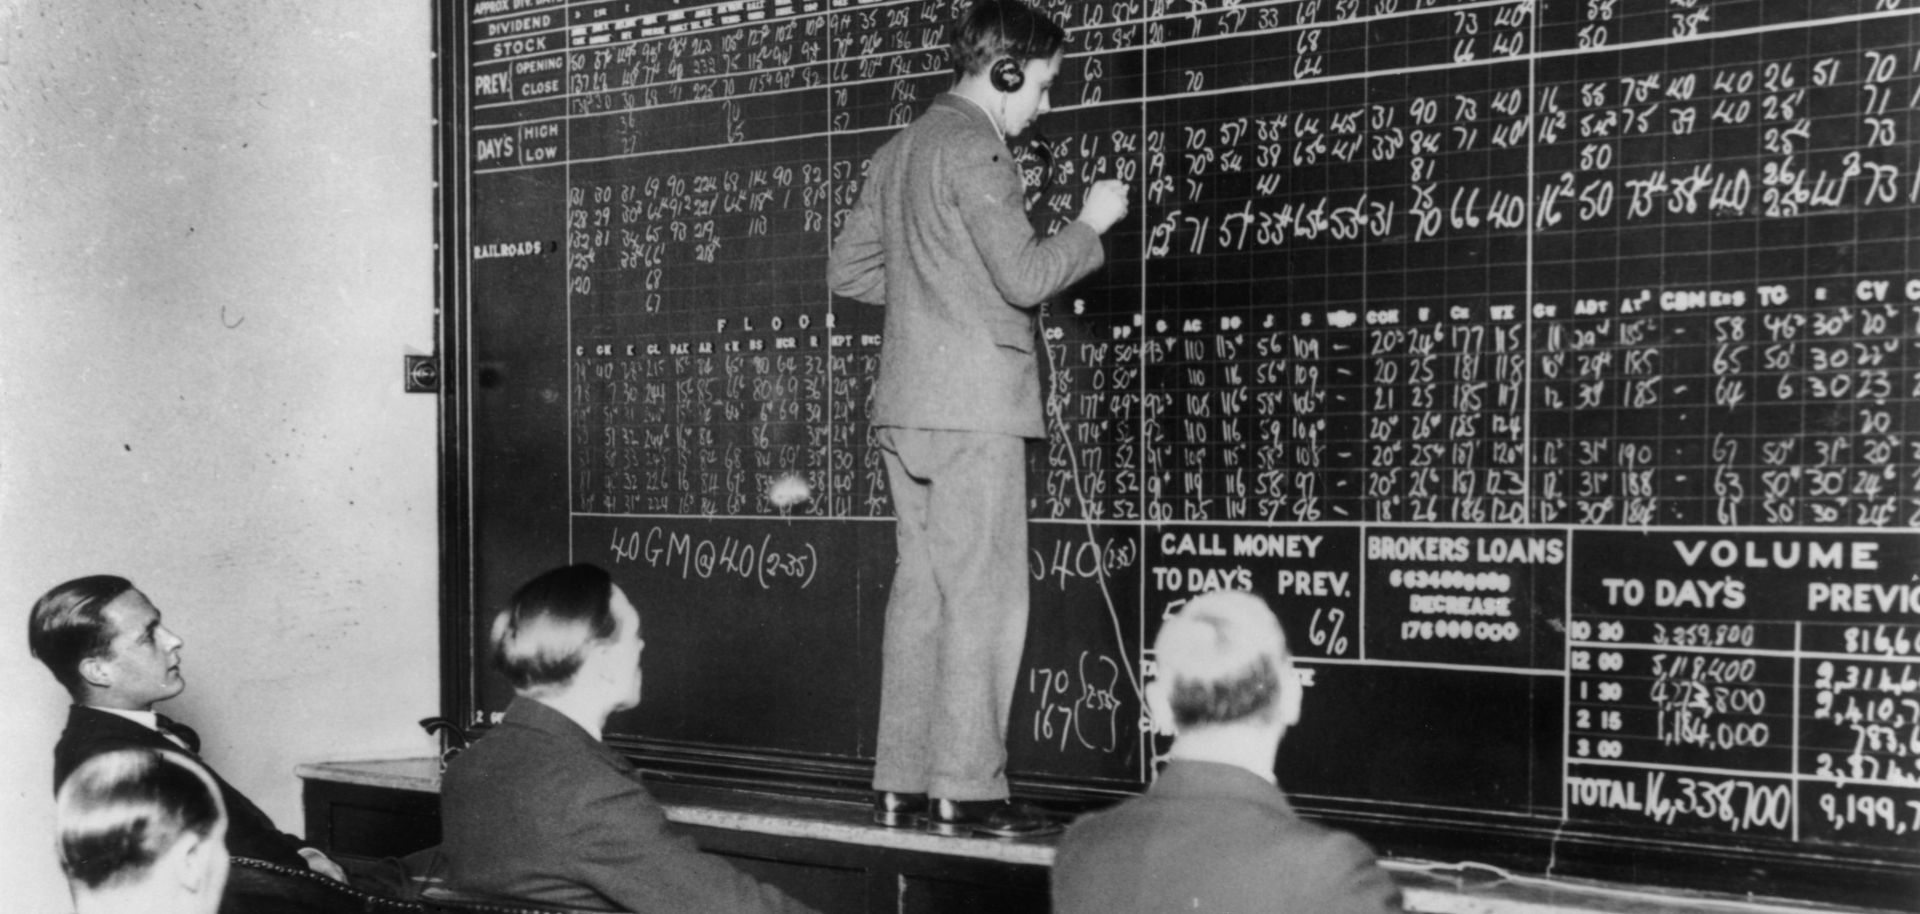
A telephone operator in London records the changes in New York's crashing stock market in 1929 as a few men look on with interest.
(London Express/Getty Images)
Subscribe to view this article
Subscribe Now
SubscribeAlready have an account?